“I absolutely CANNOT WAIT to cut and paste data into spreadsheets every week,so I can send a report to my boss” said no one ever.
We have served thousands of HubSpot customers with our website templates and marketing automation setup services. Not a single marketer has ever uttered the sentence above.
But, as soon as our customers deploy their new site and double down on their online marketing, it usually dawns upon them: they now have to track even more marketing data than before. And that data is now dispersed across even more services: Google analytics, HubSpot, Wistia, Drift, Adwords, Facebook ads, Twitter -- the list goes on.
As a result of this difficulty, most marketers only check data once per month or check only a few stats each week. Or, if they want to do it more frequently, they might assign a team member to pull some data from each service and put it in a spreadsheet. Or perhaps take a screenshot and paste it into a powerpoint to save some time. Or keep a bunch of browser tabs open to toggle between different reports from different services -- enough to make anyone dizzy.
So, today, we’re officially launching a new Brand Builder Solutions Service. Just like we make it easy to produce beautiful and ROI-producing websites with our website templates, our Automated Reporting Services make it possible to launch beautiful, consolidated ROI-monitoring dashboards.
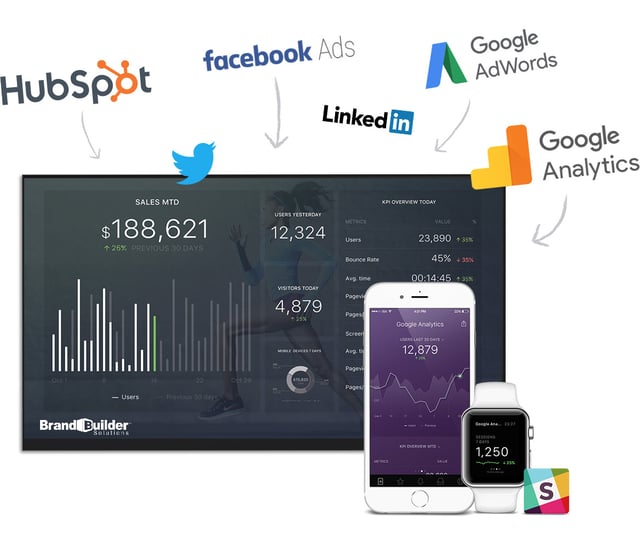
Reporting templates allow you to measure progress towards monthly sales and marketing goals on TV, desktop, mobile, Slack and Apple Watch. You can display your data throughout the office, and on all your personal devices.
We can give you up-to-date updates on 30+ services, including all HubSpot products, Google Analytics, SEMRush, pay-per-click campaigns, social media services and many more.
If you have goals for monthly performance, we can add those to your reports and alert you on progress (or lack thereof) by email, slack or via a mobile app. If something is going desperately wrong in your e-commerce store or organic search is dipping, we can set up alerts to monitor everything and proactively notify you of issues before they become big problems. You can even send the boss an alert on their phone when traffic goes through the roof or when that email campaign creates an avalanche of leads.
Here’s how we get you setup and running:
- We have 100+ dashboards on all sorts of sales and marketing metrics. We do a planning session to determine which 5 to 10 of ‘em fit your business.
- We show you how to enter goals and create alerts as we enter a few of them together.
- We’ll give you instructions for setting up report access: mobile, desktop, TV, slack.
- We’ll add your employees to the system.
And that is pretty much it. In 60 minutes, you will have live metrics from multiple services on every device, all centered around your company’s goals.
Here are Some Example Templates
As you know, we’re big believers in HubSpot’s Inbound Methodology and their Sales & Marketing Growth Stack. We use all their products and our customers do too. But, we also use other tools like Drift, Wistia and Google Analytics. We know you do too.
So to make these templates easy to browse, we broke them into 4 categories that mirror the inbound methodology: Whole Sales + Marketing Funnel, Top of Marketing Funnel, Middle of Marketing Funnel and Bottom of the Funel or Sales.
(All templates shown are the desktop view. Mobile views can show the same data. We have both IOS and Android apps available.)
Whole Sales + Marketing Funnel
Full Sales & Marketing Funnel
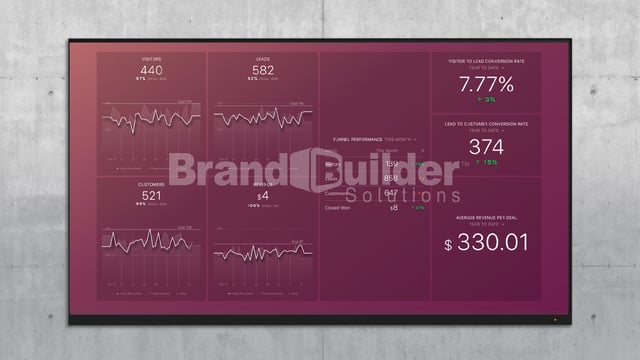
Use this dashboard to align your marketing goals with overall revenue revenue target. Track movement at every part of the funnel.
Top of Marketing Funnel
Social Media Follower Count Tracking
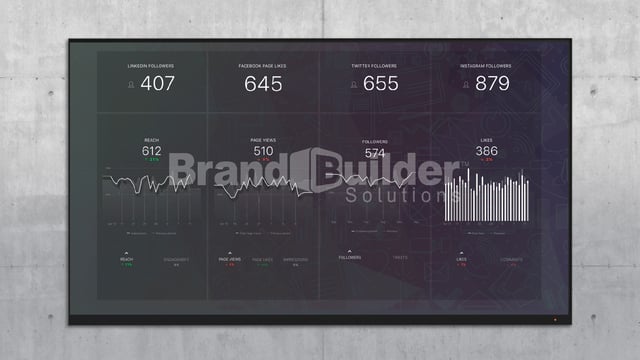
Keep up with your presence on all 4 major social media platforms by tracking following and engagement.
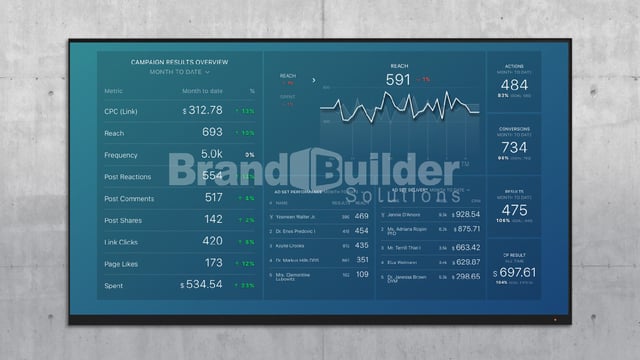
Facebook Page Interaction and Content Tracking
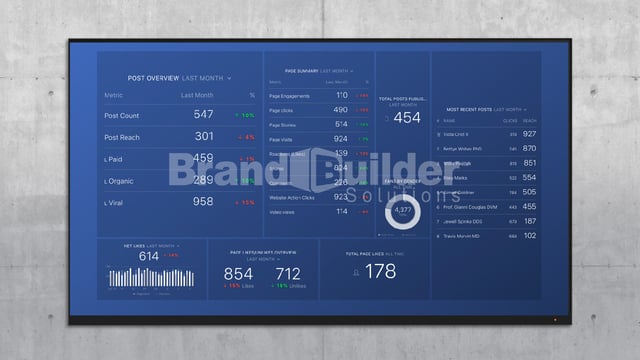
Learn what type of content works best for your Facebook audience. Similar tracking available for Linkedin Company Page, Twitter and Instagram too.
HubSpot Blogging Performance
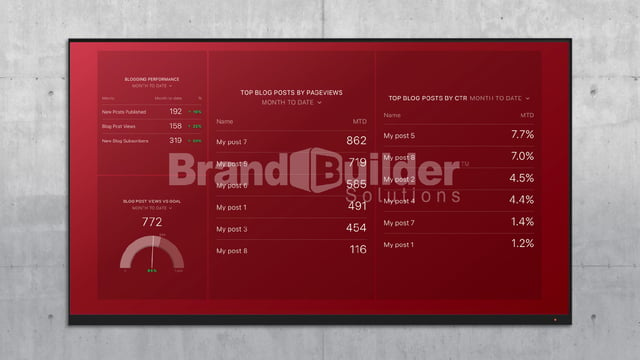
Discover which blogging topics drive the most engagement.
High Level Google Analytics
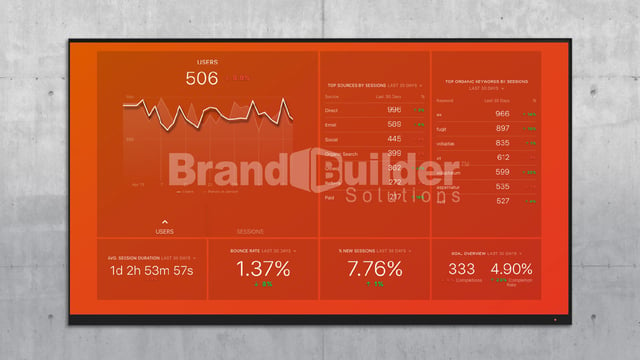
See where your site gets its traffic and whether you meet key usability goals.
HubSpot Landing Page Performance
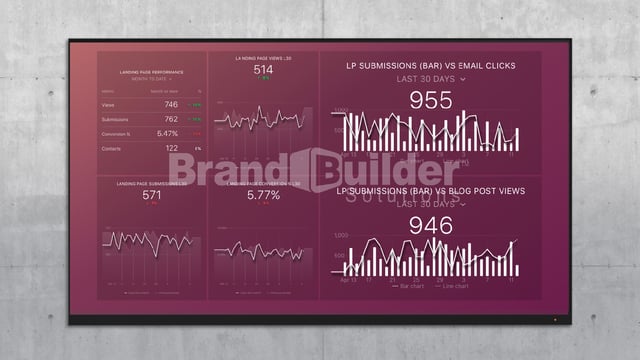
Monitor the conversion rate of your landing pages and the impact of email and blogging on your lead generation.
Google Adwords Performance
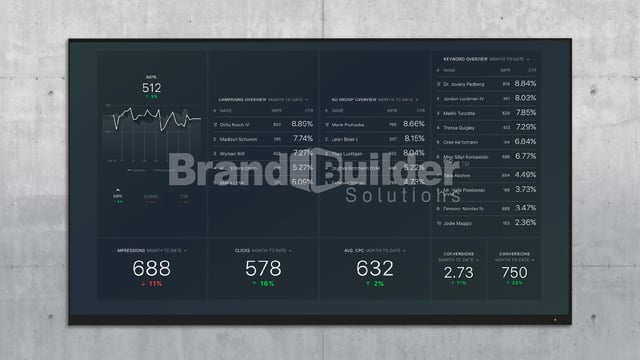
See which keywords get you affordable traffic.
Middle of Marketing Funnel
Wistia Video Tracking
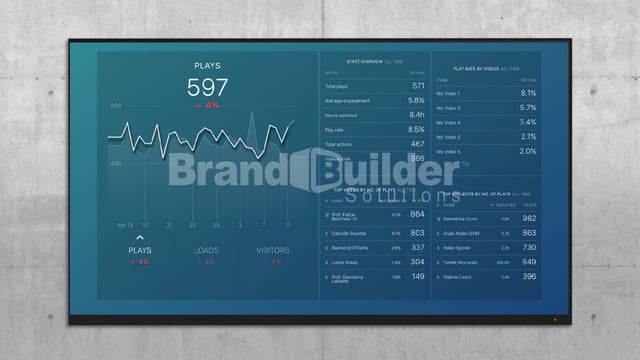
See which videos get plays and engagement.
HubSpot Email Performance
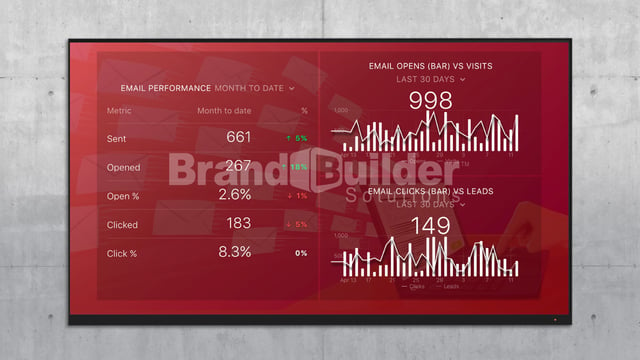
Track whether your email changes are driving more or less opens and clicks over time.
Drift Chat Tracking
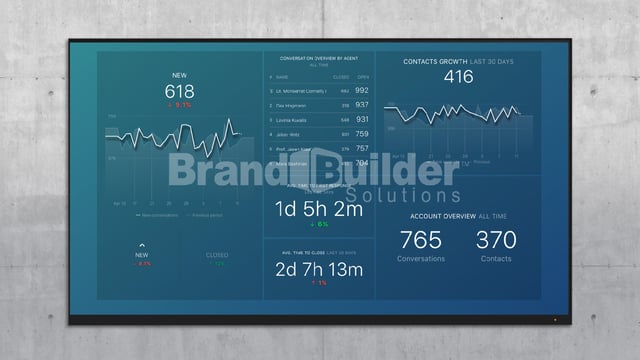
Measure the effectiveness of live chat on your site.
HubSpot Lead Source Tracking
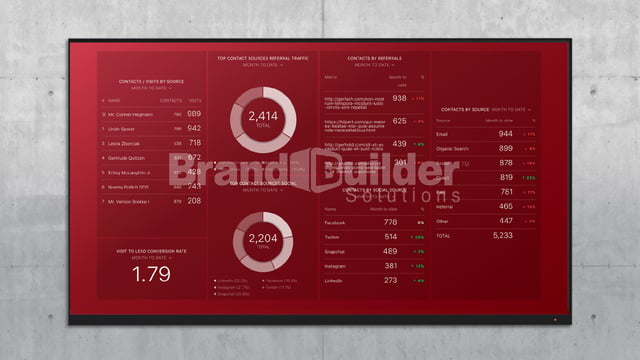
Decide where you should focus your top of funnel activity based on the volume of leads each marketing channel is driving.
Facebook Ad Campaign Performance
Learn how your Facebook followers engage with your ads.
Sales
HubSpot Sales Opportunity Source Tracking
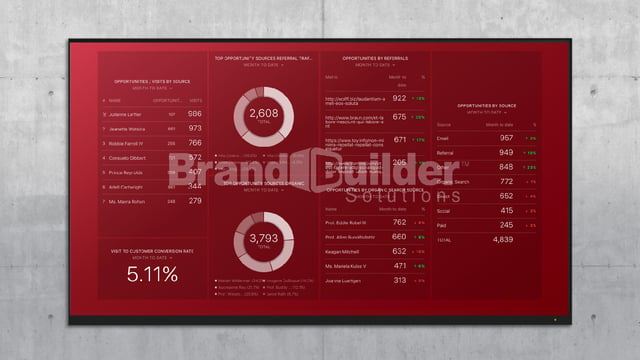
Optimize your funnel based on the leads that turn into opportunities
HubSpot Sales Team Activity Tracking
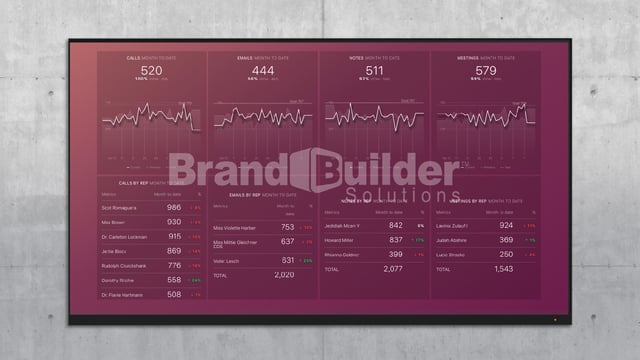
See if your sales team is doing enough to fill the funnel.
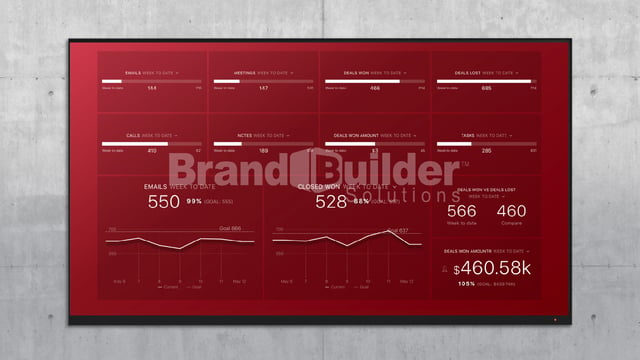
HubSpot Sales Forecast and Performance
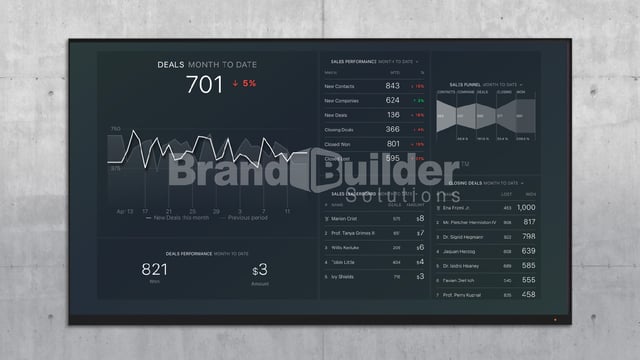
See if you are on track to meet your monthly revenue target.
HubSpot Individual Rep Tracking
Use one of these dashboards per rep to make sure they are on track to meet targets.
So, How Much Does this All Cost, Joe?
For $59/mo, here is what you get:
- Track metrics from up to 10 different tools.
- Up to 10 different reports, selected from our list of 100+ templates.
- Ability to view data on desktop, mobile and TV.
- Receive alerts via mobile app, slack and/or email.
- Set as many goals and alerts as you’d like. We'll help you set your first few.
- Up to 5 users in the mobile app.
For higher monthly fees, you can track more data sources, have more reports or have more users.
For additional setup fees, we can build custom reports, pull in data from other sources not covered yet by our service and provide consulting to help you set reasonable goals and improve your performance over time.
Request A No-Obligation, Free Analytics Consultation
If you are tired of rummaging through services with wildly different user interfaces, or want to just stay up to date when you're not sitting in front of your computer, or want to start proactively monitoring for issues and performance to goal in near real-time for every metric that matters, then this is the easiest and least expensive solution you’ll find.
Using data to make marketing and sales decisions is the key to leveraging your website to get new business. We’re excited to take this next step in our mission to help clients do just that.
Request a consultation if you’d like to learn more.
